Penlight
If residents, not officials, chose the metrics, what would a good ward look like?
The question
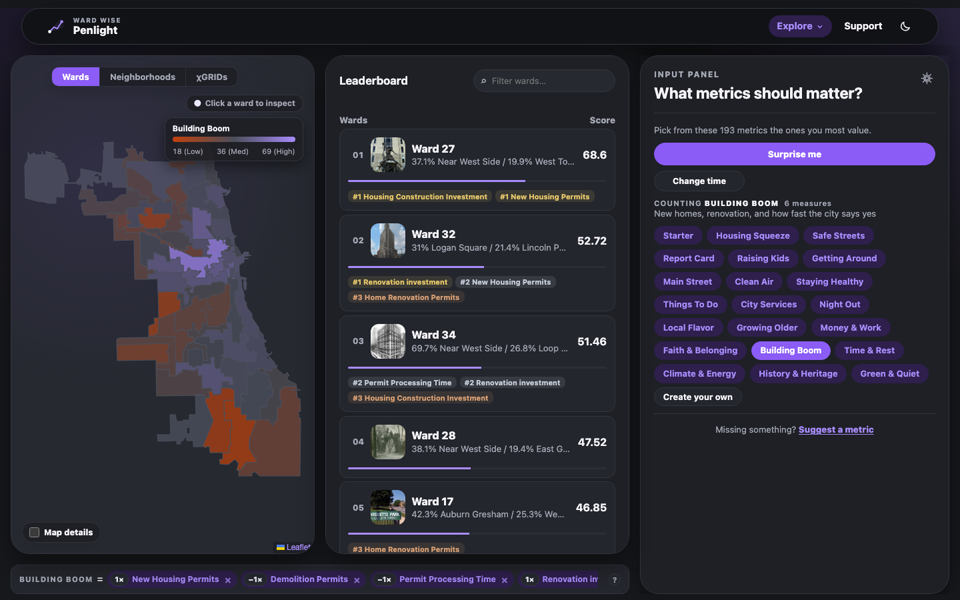
Cities publish mountains of open data and almost none of it is organized around how residents actually feel about where they live. Penlight lets a community pick and weight its own wellbeing metrics and see the result on a map.
Collect
Dozens of metric sources, each an open repository with a documented method: parking supply, sun access, chain-restaurant share, absentee ownership, third places, environmental-justice indicators and more, all reported annually by ward, community area and χGRID.
Analyze
Every metric enters a composite through a transparent, editable weighting. Component deltas are computed first, so a change in the index can always be traced to the metric that moved it.
Present
A live Leaflet choropleth of Chicago, a metric dictionary, and a support page where residents nominate new metrics or bring Penlight to another city.
Partners
Built at Chi Hack Night with Gross National Happiness USA.